Gantt Chart
A Gantt Chart is a visual way to display scheduled tasks. Horizontal graphs are widely used for planning projects of all sizes in various industries and areas. This is a convenient way to show what work is planned to be performed on a specific day and time.
You have the ability to create a Gantt chart to any entity with Start Date and End Date fields.
The standard version of the dhtmlxGantt library is used to build the Gantt chart.
Creating Report
Go to the "Extension-Reports-Gantt Chart" page and create a new report. In the form, select the entity for which the report will be created and link the "start date" and "end date" to the corresponding fields in the selected entity.
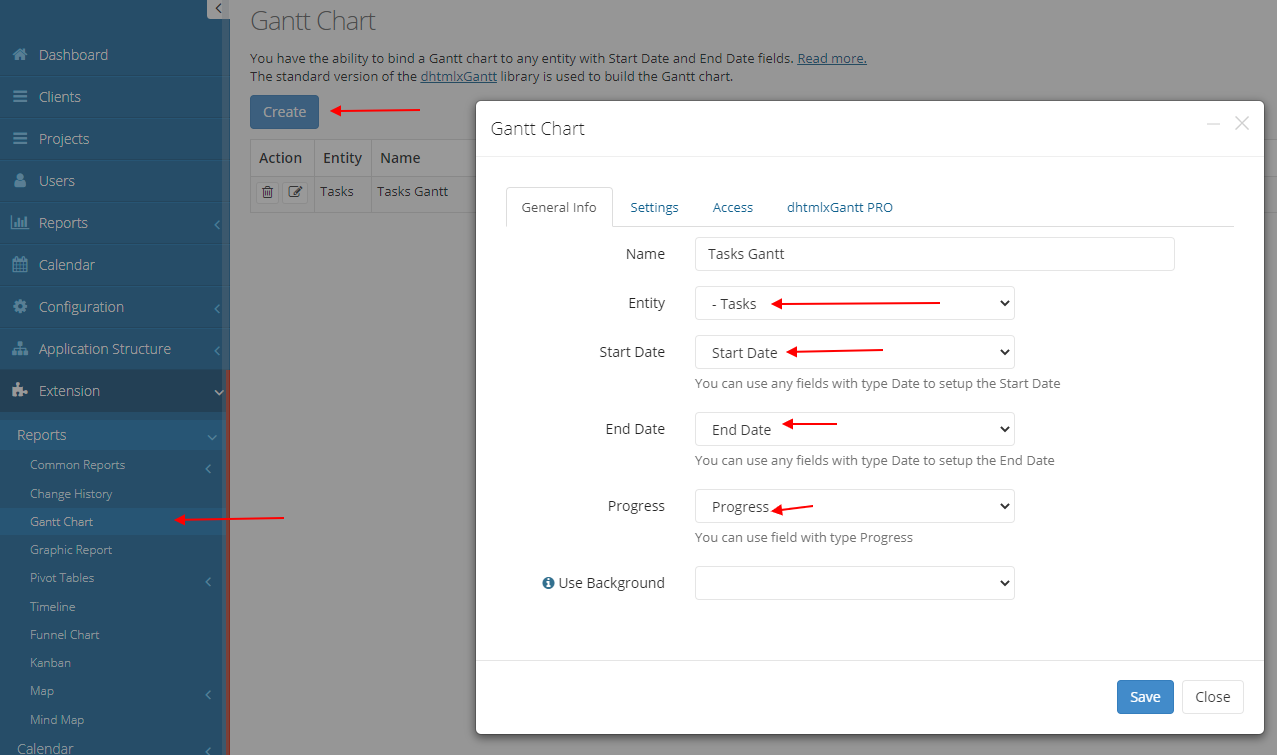
If you use the Progress field by specifying these fields in the report settings, the program displays the progress of the task on the chart.
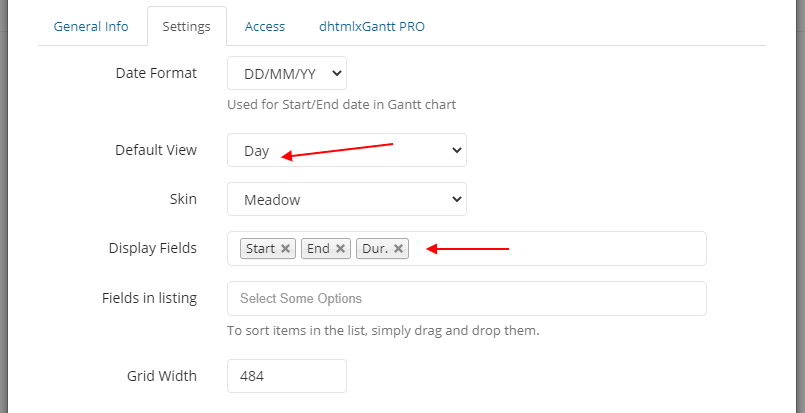
On the Settings tab, specify the default view, skin, and fields in the list.
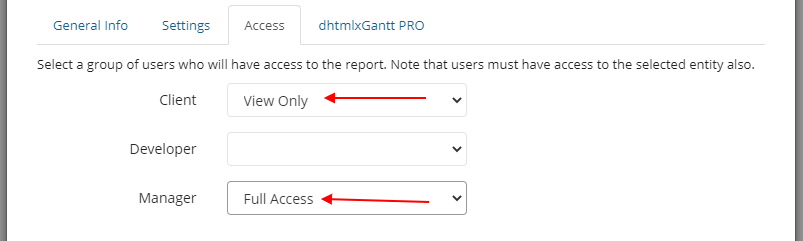
On the Access tab, specify which user groups will have access to view or manage data in the report.
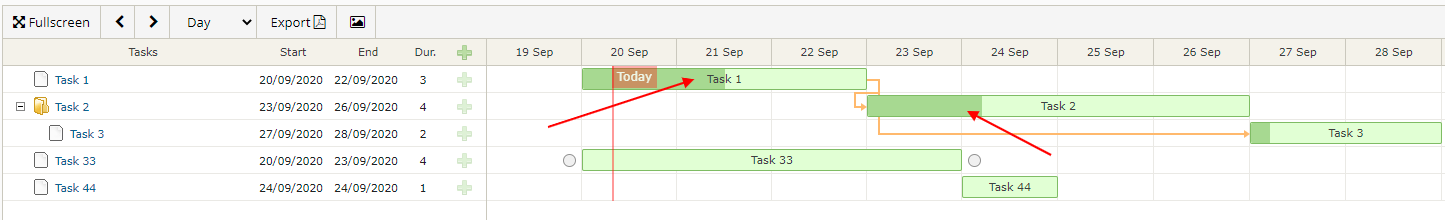
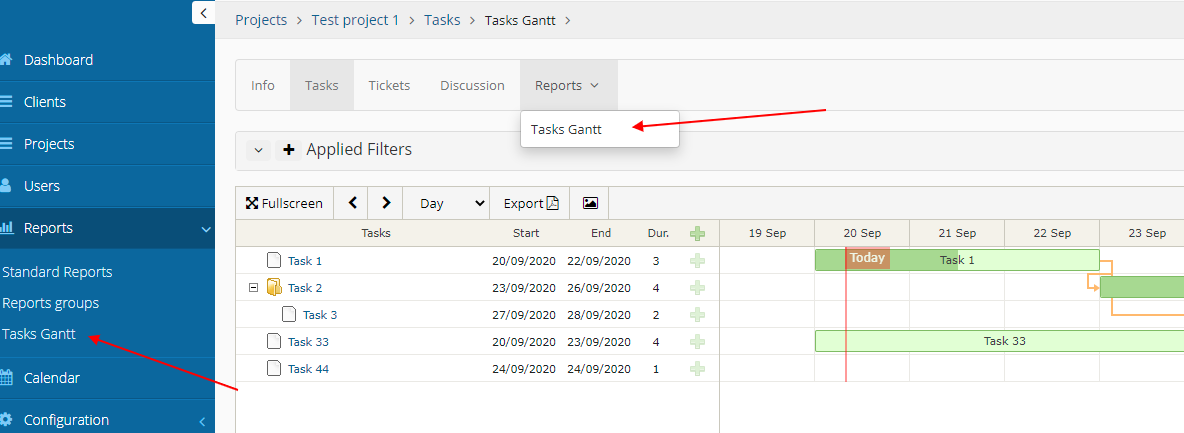
The created report is available in the Reports menu. If you create a report for a nested entity, such as a Task, you can open the Gantt chart for each project separately.
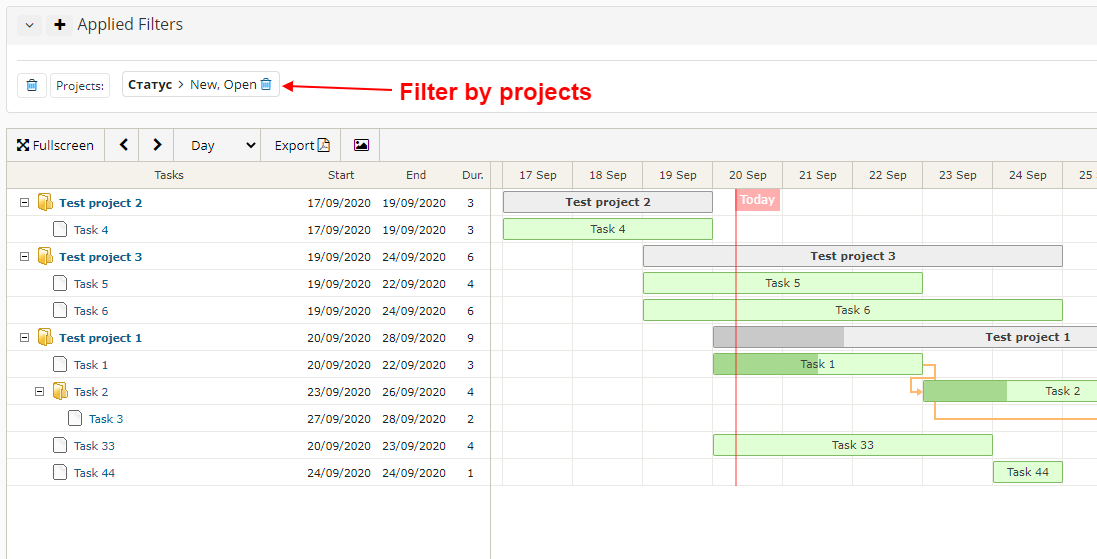
Project summary report
If a report was created for a nested entity, such as a Task, you can now add this report to the menu and display a diagram for all projects at the same time.
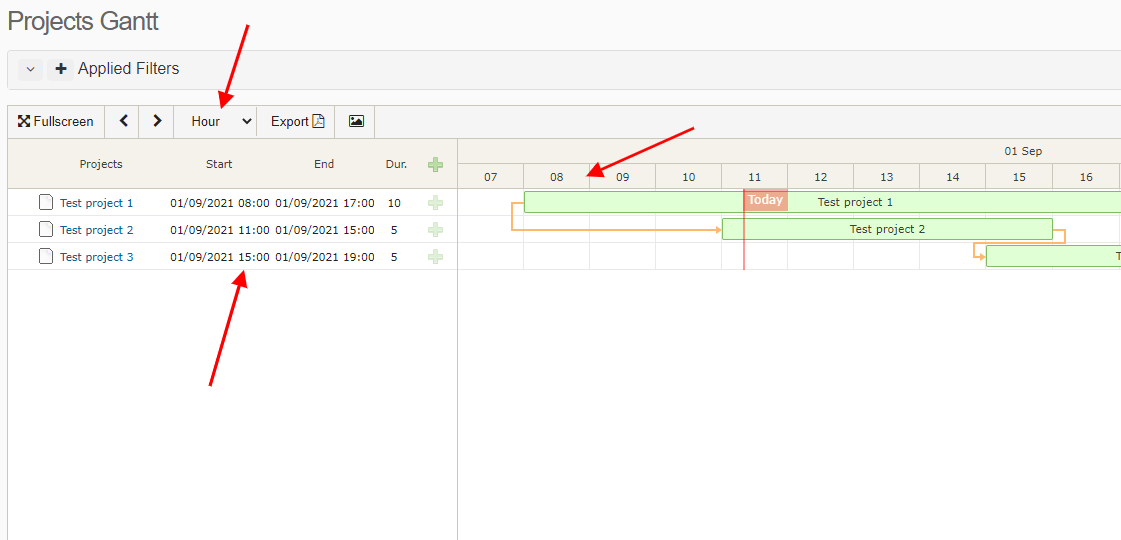
View: Hour
New feature for version 3.0
If the "Date with calendar and time picker" field type is used as the End Date, the duration of the task is automatically calculated in hours and, accordingly, the "Hour" view type can be used for the timeline.
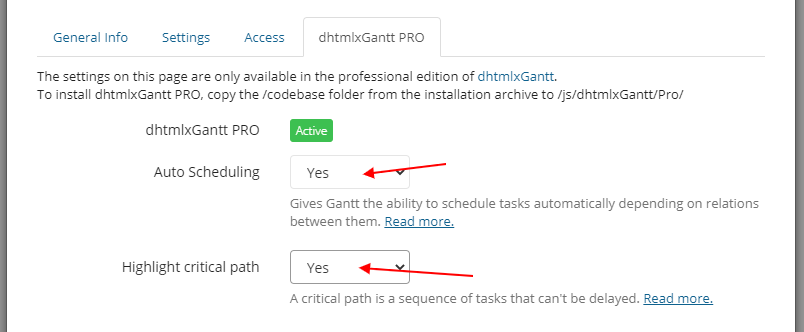
dhtmlxGantt PRO
The professional (paid) version of dhtmlxGantt offers advanced functionality and a set of advanced features.
The dhtmlxGantt PRO tab provides features from the paid version that are integrated into the system.